Temperature sensor placement is not an arbitrary decision. Strategic location determines monitoring accuracy, the early detection of deviations, and regulatory compliance in regulated industries such as pharmaceuticals and biotechnology.
Why Is Sensor Placement Critical?
Storage spaces do not have a uniform temperature. There are thermal gradients, hot spots, and cold zones that can compromise the integrity of sensitive products such as enzymes, molecular biology reagents, vaccines, and thermolabile medications.
Consequences of Poor Placement
- False negatives: Failing to detect real thermal excursions
- False positives: Unnecessary alerts caused by inadequate placement
- Product loss: Undetected degradation of critical reagents
- Regulatory non-compliance: Violation of CFR 21 Part 11, WHO, FDA
- Operating costs: Avoidable deviation investigations
Scientific Fundamentals of Thermal Mapping
Thermal mapping (temperature mapping) is the systematic process of identifying temperature variations within a controlled space. According to WHO and FDA guidelines, this process must be carried out before the permanent installation of sensors.
Key Physical Principles
Thermal Stratification
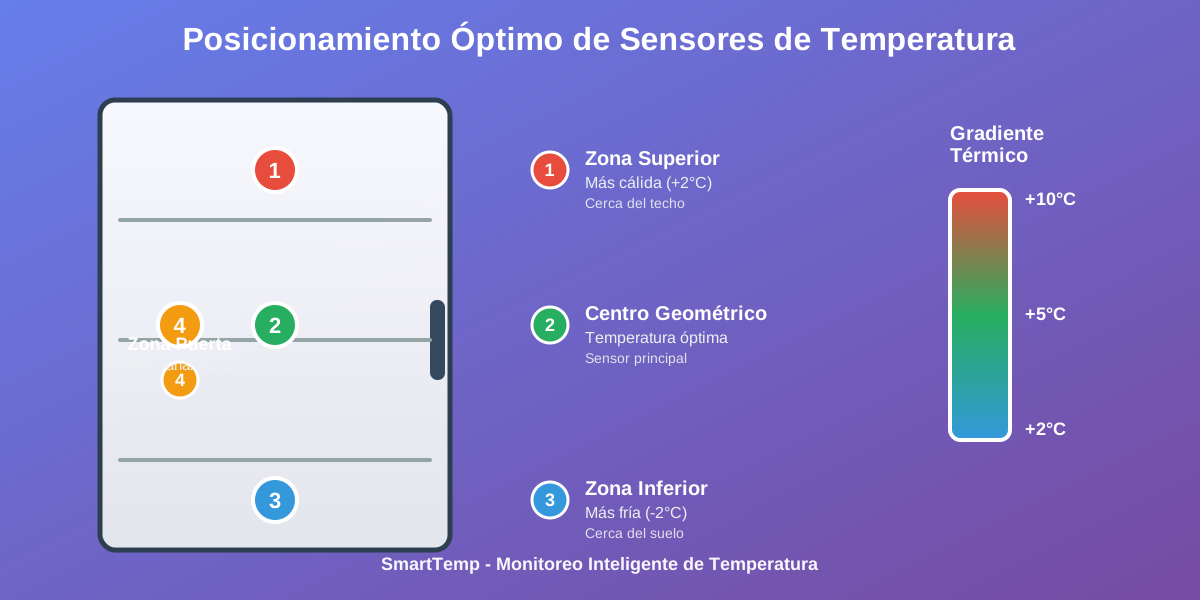
Warm air rises, creating vertical gradients. In refrigerators, the difference between the top and bottom can be 2-5°C.
Airflow
Ventilation systems create zones of high and low circulation. Areas with reduced flow are more susceptible to deviations.
Entry Points
Doors, hatches, and drainage systems are sources of thermal infiltration. They require priority monitoring.
Thermal Loads
Internal equipment, lighting, and products generate heat. Load distribution affects thermal homogeneity.
Optimal Placement Methodology
Phase 1: Initial Thermal Mapping Study
Before installing permanent sensors, a mapping study should be conducted with multiple measurement points over 24-72 hours.
| Equipment Type | Minimum Points | Study Duration | Conditions |
|---|---|---|---|
| Small refrigerator (<200L) | 9 points | 24 hours | Empty and loaded |
| Cold room (2-8°C) | 15-25 points | 48-72 hours | Maximum and minimum load |
| Ultra-low freezer (-80°C) | 12-20 points | 48 hours | Different load levels |
| Temperature-controlled warehouse | 1 point per 50m³ | 72 hours | Summer and winter |
Phase 2: Identifying Critical Points
Analysis of the thermal mapping data reveals the most vulnerable zones:
Hot Spots
Areas with a consistently higher temperature. Common near compressors, lighting, or doors. They require a dedicated sensor for continuous monitoring.
Cold Spots
Zones with a lower temperature, typically near evaporators or air outlets. Risk of freezing in 2-8°C refrigerators.
High-Variability Zones
Areas with significant thermal fluctuations. They indicate insulation problems or inadequate airflow.
Placement Guides by Equipment Type
1. Pharmaceutical Refrigerators (2-8°C)
Geometric Center
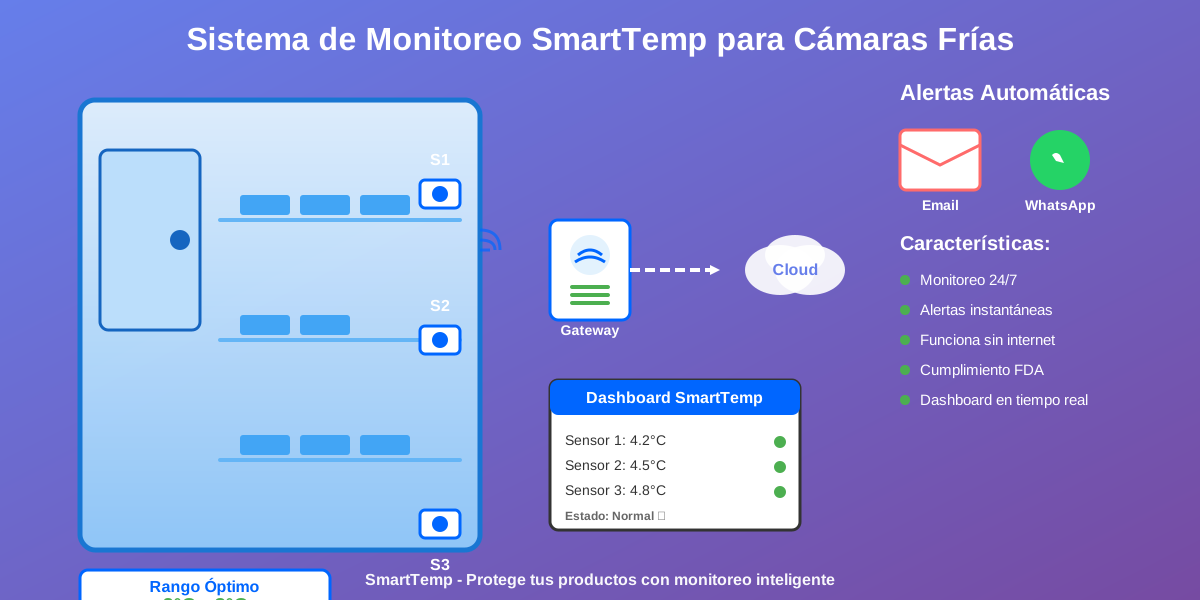
Location: Midpoint of the usable space, away from walls and the door.
Function: Represents the average temperature of the equipment. Main sensor for continuous monitoring.
Door Zone
Location: 10-15 cm from the door, at mid-height.
Function: Detects excursions from frequent opening. Critical in high-traffic areas.
Top Section
Location: Top shelf, rear corner.
Function: Monitors thermal stratification. Typically the warmest zone.
Bottom Section
Location: Bottom shelf, center.
Function: Detects cold zones. Risk of freezing sensitive products.
2. Ultra-Low Freezers (-80°C)
Ultra-low freezers present unique challenges due to the extreme temperatures and the criticality of the stored samples.
Distribution by Level
- Top level: Sensor in the top rack, central zone
- Middle level: Main sensor, represents the average temperature
- Bottom level: Sensor near the compressor, the coldest zone
- Door: Additional sensor to detect openings
Special Considerations
- Use sensors with an extended range (-90°C to +50°C)
- Sensor cables must be resistant to low temperatures
- Avoid condensation at cable entry points
- Power backup is mandatory with a failure alarm
3. Reagent Storage Chambers
For storing enzymes and molecular biology reagents, precision is critical.
| Reagent Type | Optimal Temperature | Tolerance | Sensor Location |
|---|---|---|---|
| Restriction enzymes | -20°C | ±2°C | Center + door |
| Taq polymerase | -20°C | ±2°C | Center + top |
| Primers/Oligonucleotides | -20°C | ±3°C | Center |
| RNA samples | -80°C | ±5°C | Multi-level (3 sensors) |
| Buffers and solutions | 4°C | ±2°C | Center + door |
Optimizing IoT Alerts and Notifications
Correct sensor placement is only the first step. The intelligent configuration of alerts maximizes the effectiveness of the IoT monitoring system.
Location-Based Alert Strategies
Zonal Alerts
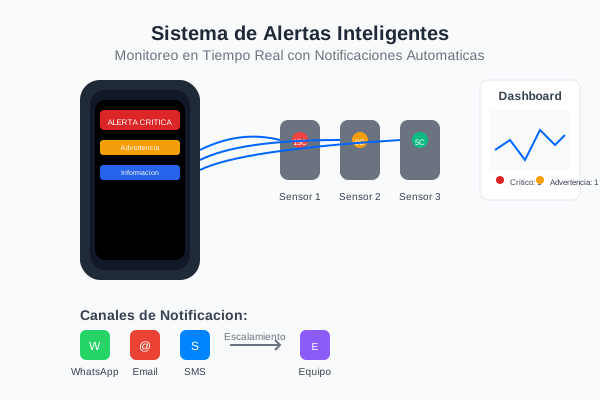
Configure specific thresholds according to sensor location. Critical zones have stricter tolerances.
Adaptive Grace Periods
Sensors near doors: 10-15 min. Central sensors: 5 min. Prevents false alarms from normal openings.
Trend Analysis
Predictive alerts based on rates of change. Detects equipment failures before critical excursions.
Multi-Sensor Correlation
Cross-validation between sensors. Alerts only if multiple sensors confirm the deviation.
Installation Best Practices
1. Distance from Walls
Keep sensors at least 10 cm from walls and surfaces. Walls act as thermal sinks or sources that distort readings.
2. Avoid Direct Airflow
Do not place sensors directly in the airflow of fans or evaporators. This causes readings that are not representative of the general space.
3. Physical Protection
Use protective housings in high-traffic areas. This prevents mechanical damage and accidental displacement of sensors.
4. Cable Management
Cables should enter through points that minimize thermal infiltration. Use appropriate seals and avoid doors compressing the cables.
5. Labeling and Documentation
Each sensor must have a unique identifier, an installation date, and its exact location documented on the equipment layout.
Regulatory Compliance
International regulations establish specific requirements for temperature monitoring in regulated industries.
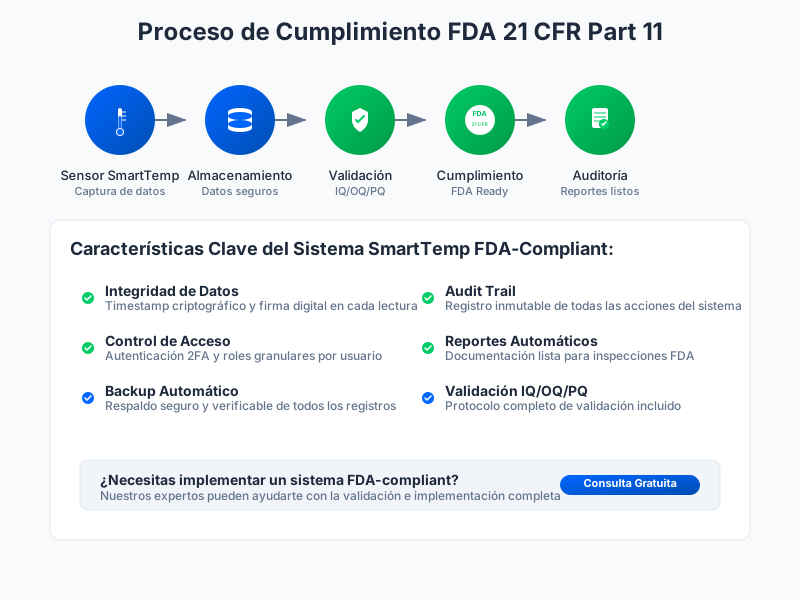
CFR 21 Part 11 (FDA)
Key Requirements:
- System validation: Document that sensors are located at representative points
- Traceability: Electronic records with digital signature and timestamp
- Audit trail: Complete history of changes to sensor configuration
- Calibration: Calibration certificates traceable to NIST standards
WHO Guidelines (World Health Organization)
The WHO guidelines for the vaccine cold chain specify:
- Mandatory thermal mapping before operational use
- Sensors must be in the product storage zone, not on walls
- Continuous monitoring with recording every 15 minutes at most
- An alarm system independent of the control system
Case Studies
Case 1: Molecular Biology Laboratory
Challenge: Loss of PCR reagents due to undetected thermal excursions in a -20°C freezer.
Analysis: Thermal mapping revealed an 8°C difference between the top section (near the door) and the bottom section.
Solution: Installation of 3 sensors: top, middle, and bottom. Alert configuration with differentiated thresholds by zone.
Result: A 95% reduction in reagent loss. Early detection of a compressor failure prevented a $50,000 loss in enzymes.
Case 2: Pharmaceutical Warehouse
Challenge: A 200m³ cold room with variations of up to 6°C between zones.
Analysis: A 72-hour mapping study with 25 measurement points identified 3 hot spots near the lighting.
Solution: Relocation of lighting, improved airflow, installation of 8 permanent sensors in a mesh network.
Result: Thermal homogeneity improved to ±1.5°C. Full compliance with the FDA audit.
Emerging Technologies
Wireless Sensors with Mesh Networking
SmartTemp technology uses mesh networks that allow for:
- Cable-free installation: Eliminates thermal infiltration points
- Automatic redundancy: If a sensor fails, the network self-reconfigures
- Scalability: Add sensors without modifying infrastructure
- Long-lasting battery: Up to 5 years without maintenance
Artificial Intelligence for Optimization
Machine learning algorithms analyze historical patterns to:
- Predict equipment failures before they occur
- Optimize alert thresholds according to environmental conditions
- Recommend sensor relocation based on data analysis
- Detect subtle anomalies imperceptible to operators
Implementation Checklist
Planning Phase
- ☐ Review equipment layouts and specifications
- ☐ Identify applicable regulatory requirements
- ☐ Define the criticality of stored products
- ☐ Establish budget and timeline
Mapping Phase
- ☐ Conduct a thermal mapping study (24-72h)
- ☐ Analyze data and generate heat maps
- ☐ Identify critical points and problem zones
- ☐ Document findings in a technical report
Installation Phase
- ☐ Install sensors in the determined locations
- ☐ Configure the monitoring and alert system
- ☐ Perform connectivity and alarm tests
- ☐ Train operational staff
Validation Phase
- ☐ Execute the qualification protocol (IQ/OQ/PQ)
- ☐ Verify the calibration of all sensors
- ☐ Document the system in SOPs
- ☐ Establish a preventive maintenance program
Conclusion
Optimal temperature sensor placement is a science that combines principles of thermodynamics, data analysis, and regulatory knowledge. It is not enough to "place a sensor in the refrigerator" - strategic location makes the difference between an effective monitoring system and one that creates a false sense of security.
Investments in thermal mapping and correct sensor placement are quickly recovered by preventing product loss, reducing deviation investigations, and ensuring regulatory compliance during audits.
Key Points to Remember
- Thermal mapping is mandatory before permanent installation
- Each type of equipment requires a specific placement strategy
- Sensors must be located in representative zones, not at the extremes
- Optimizing IoT alerts maximizes the effectiveness of the system
- Regulatory compliance requires thorough documentation
- Wireless technology simplifies installation without compromising precision
Need Advice on Sensor Placement?
Our team of specialized engineers can perform thermal mapping of your facilities and design an optimized monitoring system for your operation.
Request Technical Consulting